Documentation Dashboard Overview
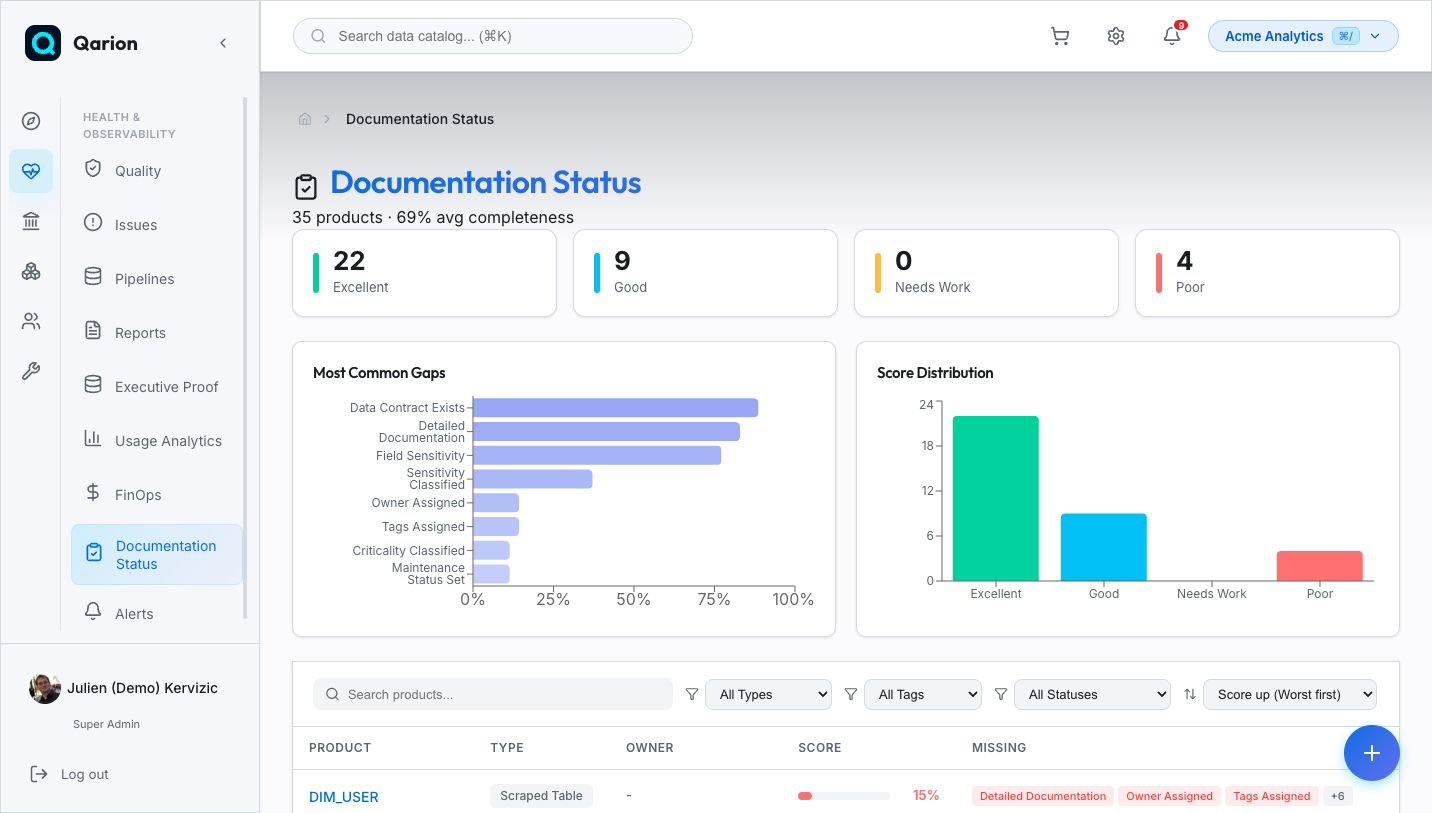
The Documentation Dashboard shows how complete product documentation is across a space or organization. Use it as a triage board: find low-scoring products, identify the metadata signals most often missing, and jump directly to product detail pages to fix the gaps.
When To Use It
- During catalog onboarding, to find products that need baseline descriptions, owners, tags, or classifications.
- Before governance reviews, to prioritize products with poor or incomplete documentation.
- After schema syncs, to confirm field descriptions and field sensitivity metadata are still healthy.
- During audit preparation, to prove that critical products have enough context for reviewers.
- Across an organization, to compare documentation quality by source space and route cleanup to the right owners.
Dashboard Views
Open /documentation-status from the product documentation area. The dashboard loads from the current space by default. If organization view is enabled, it aggregates the same scoring model across spaces in the selected organization and adds a source-space column to the table.
The page includes:
- Summary cards for documentation score buckets.
- A Most Common Gaps chart, showing the signals missing from the largest share of products.
- A Score Distribution chart, showing how many products fall into each score band.
- A product table with links to product detail pages, product type, owner, score, and missing-signal chips.
- Search, type, tag, maintenance-status, sort, and pagination controls.
Score Interpretation
Each product receives a weighted completeness score from 0 to 100. Scores are computed from existing catalog metadata every time the dashboard loads, so the dashboard reflects current product state rather than a stored audit snapshot.
| Score bucket | Range | How to interpret it |
|---|---|---|
| Excellent | 75-100 | Product has most required governance and field documentation. Review only if it is high criticality, regulated, or recently changed. |
| Good | 50-75 | Product has useful baseline documentation but is missing some signals. Clean these up during normal stewardship. |
| Needs Work | 25-50 | Product is not ready for broad reuse or governance review without targeted remediation. |
| Poor | 0-25 | Product is missing core documentation. Prioritize before approving reuse, access expansion, or audit evidence. |
The score is based on these signals:
| Signal | Weight | Filled when |
|---|---|---|
| Description | 15% | Product has a short description. |
| Detailed Documentation | 15% | Product has a long-form description or detailed documentation. |
| Owner Assigned | 15% | Product has at least one governance owner. |
| Tags Assigned | 10% | Product has one or more tags. |
| Sensitivity Classified | 10% | Product sensitivity is set. |
| Criticality Classified | 8% | Product criticality is set to something other than non-critical. |
| Maintenance Status Set | 7% | Product maintenance status is set and is not undocumented. |
| Field Descriptions | 10% | At least 50% of fields have descriptions. |
| Field Sensitivity | 5% | At least 50% of fields have sensitivity metadata. |
| Data Contract Exists | 5% | Product has a data contract. |
Field coverage percentages are shown separately from the overall score. A product with no fields is treated as fully covered for field descriptions and field sensitivity, because there are no field-level entries to document.
Gap Analysis Workflow
Start with the Most Common Gaps chart when you need to plan cleanup across many products.
- Click the largest gap bar to filter the table to products missing that signal.
- Sort by lowest score first to identify the most urgent products in that filtered set.
- Use type, tag, and maintenance-status filters to narrow the work to a domain, platform, lifecycle state, or stewardship group.
- Open each product from the table and fix the missing metadata on the product detail page.
- Return to
/documentation-statusand refresh the dashboard to confirm the score and gap list changed.
Click a score bucket when you want to work by severity instead of gap type. For example, click Poor to find the least documented products, or Needs Work to work through products that are close to a usable baseline.
Only one chart filter is active at a time. Selecting a score bucket clears the selected gap filter, and selecting a gap clears the score-bucket filter. Use the active filter chip to clear the chart filter.
Filtering And Sorting
The table filters are client-side controls over the loaded dashboard data:
| Control | Matches |
|---|---|
| Search | Product name and product type. |
| Product type | Exact product type from the loaded products. |
| Tag | Products containing the selected tag. |
| Maintenance status | Product maintenance status, such as Active, Under Review, Deprecated, Archived, or Undocumented. |
| Sort | Score ascending, score descending, name ascending, or name descending. |
The table shows 10 products per page. Changing a search, filter, chart selection, or sort resets the table to the first page so the filtered results are visible immediately.
Remediation Examples
| Gap shown | Typical fix |
|---|---|
| Description | Add or update the product's short description so users understand what the product contains. |
| Detailed Documentation | Add richer business context, usage notes, caveats, source assumptions, or operating guidance. |
| Owner Assigned | Assign a product owner or governance owner who can answer questions and review changes. |
| Tags Assigned | Add domain, system, regulatory, or topic tags that make the product discoverable. |
| Sensitivity Classified | Set product sensitivity, especially for products containing PII, PHI, financial, or confidential data. |
| Criticality Classified | Set product criticality so operational and governance reviews can prioritize it correctly. |
| Maintenance Status Set | Move the product out of undocumented by setting an accurate lifecycle or maintenance status. |
| Field Descriptions | Add descriptions to at least half of the product fields. Prioritize business keys, sensitive columns, metrics, and high-use fields first. |
| Field Sensitivity | Classify at least half of fields for sensitivity. Prioritize PII, PHI, financial, and restricted fields. |
| Data Contract Exists | Create or link a data contract for products with consumers, SLAs, or published interface expectations. |
Operating Practices
- Review Poor and Needs Work buckets weekly during onboarding or catalog cleanup.
- Review top gaps after bulk imports, connector syncs, schema changes, and product-type migrations.
- Use organization view for governance programs and space view for day-to-day stewardship.
- Pair score cleanup with product criticality and sensitivity. A low-scoring critical or sensitive product should move ahead of a low-risk product with the same score.
- Do not treat the score as a legal approval. It is a documentation completeness signal that helps focus review.
Technical Reference
- User route:
/documentation-status - Space API source:
GET /api/v1.0/catalog/spaces/{slug}/documentation-status - Organization API source:
GET /api/v1.0/organizations/{org_slug}/documentation-status - Scoring service:
DocumentationStatusService
Related
- Product Details - where product descriptions, ownership, classifications, and field metadata are maintained.
- Managing Products - product stewardship and metadata upkeep.
- Data Contracts - contract coverage that contributes to documentation completeness.